ELiAH provides comprehensive information about E3 ligases. Specifically, ELiAH contains insights of inferred association gene pair and tissue specificity of gene based on transcriptomics.
Outline
Definition of field names that distinguish tissues
SampleTissue : The corresponding field is the tissue category represented by each sample.
TissueGroup : The 10 tissues were optimized into 7 tissue groups to minimize information loss during transcriptomics analysis. Similar tissues are combined into the same group as shown below. Gastrointestinal tissue : Stomach, Colon - Sigmoid, Colon - Transverse Cardiac tissue : Heart - Left ventricle, Heart - atrial Atrial appendage
How to use search pages?
list of Gene/E3 page
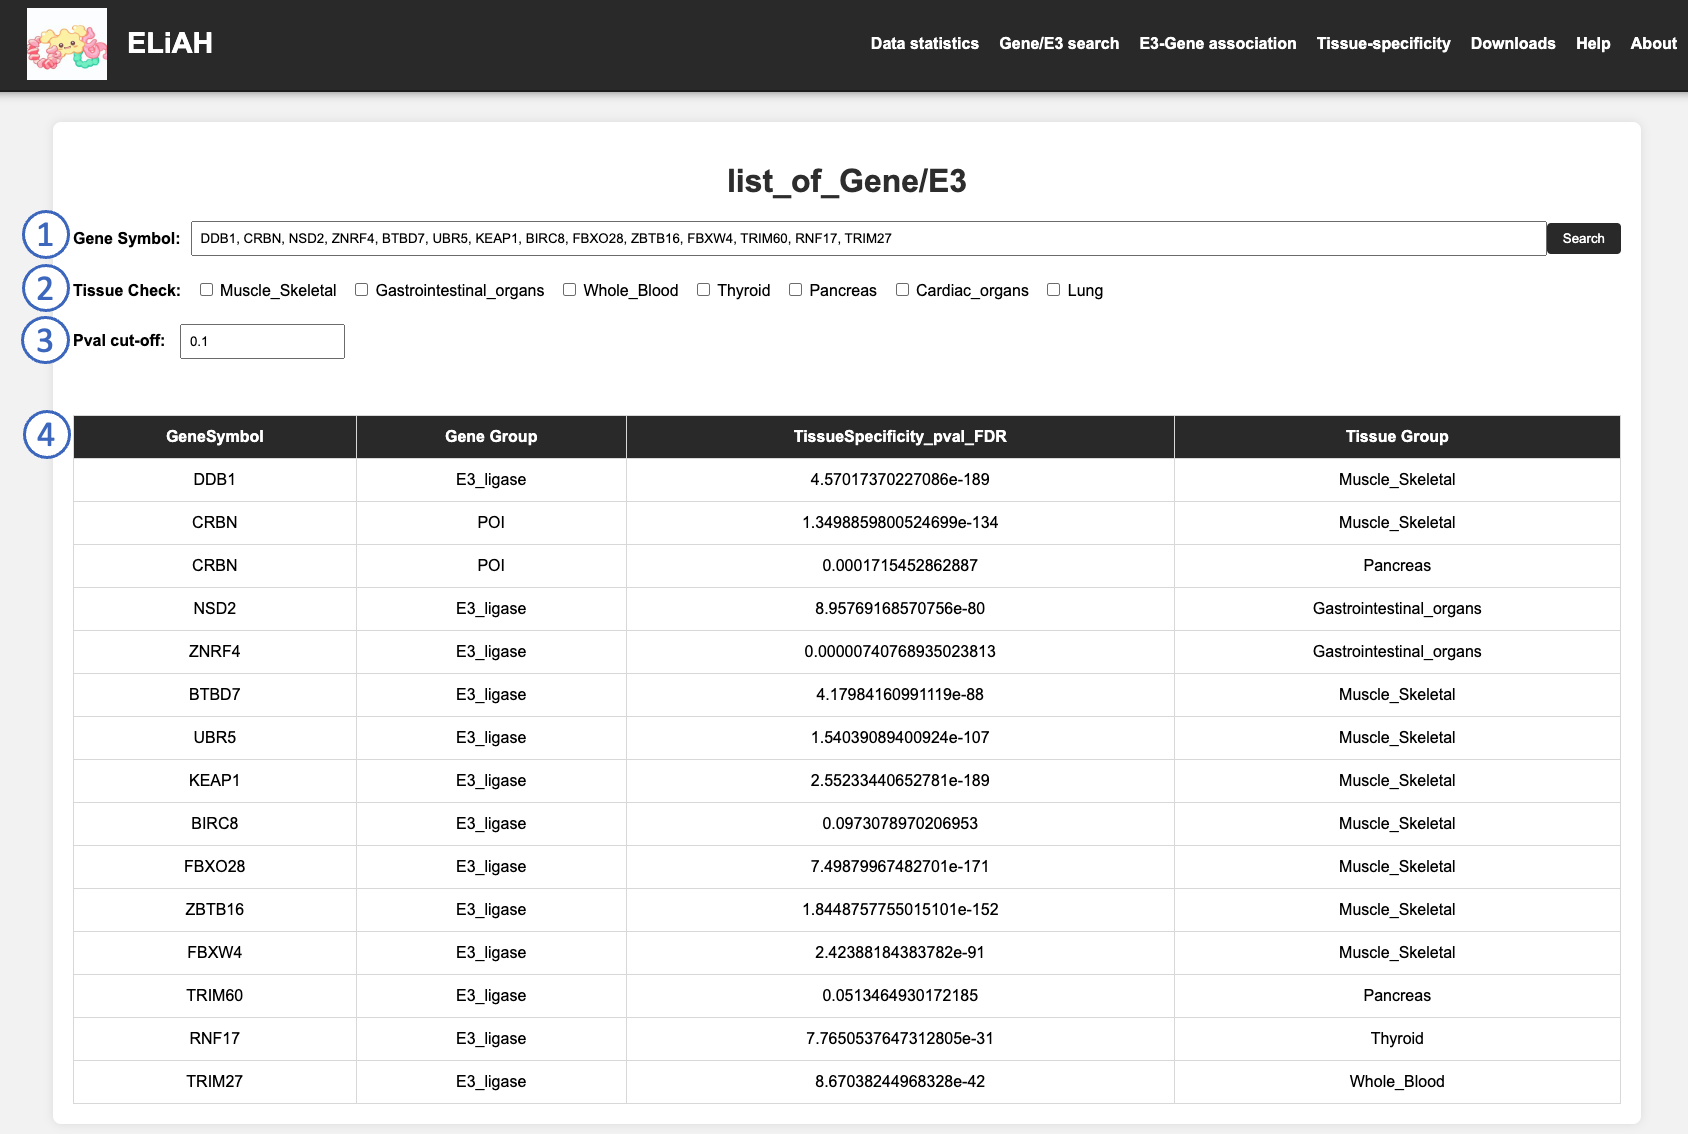
To explore for the E3 or Gene list of ELiAH, users can use the search interface at the “E3/Gene list” page.
Search box for exploring with gene list by gene symbol.
Users can choose interesting Tissue Group by click checkboxes.
Users can set the maximum P value cut off for narrow down to gene list of higher tissue specificity.
The output table of user requested E3/Gene list
[ Column description ]
GeneSymbol — gene symbol of E3 ligase or inferred gene that user requested.
GeneGroup — E3 ligase or inferred gene.
TissueSpecificity_pval_FDR — The FDR-adjusted significance value indicates the tissue specificity of a gene determined through a one-tailed Mann-Whitney U test, comparing it to other tissue groups.
TissueGroup — 7 tissue groups for transcriptomic analysis. Similar tissue samples are combined into the same group.
Tissue specificity
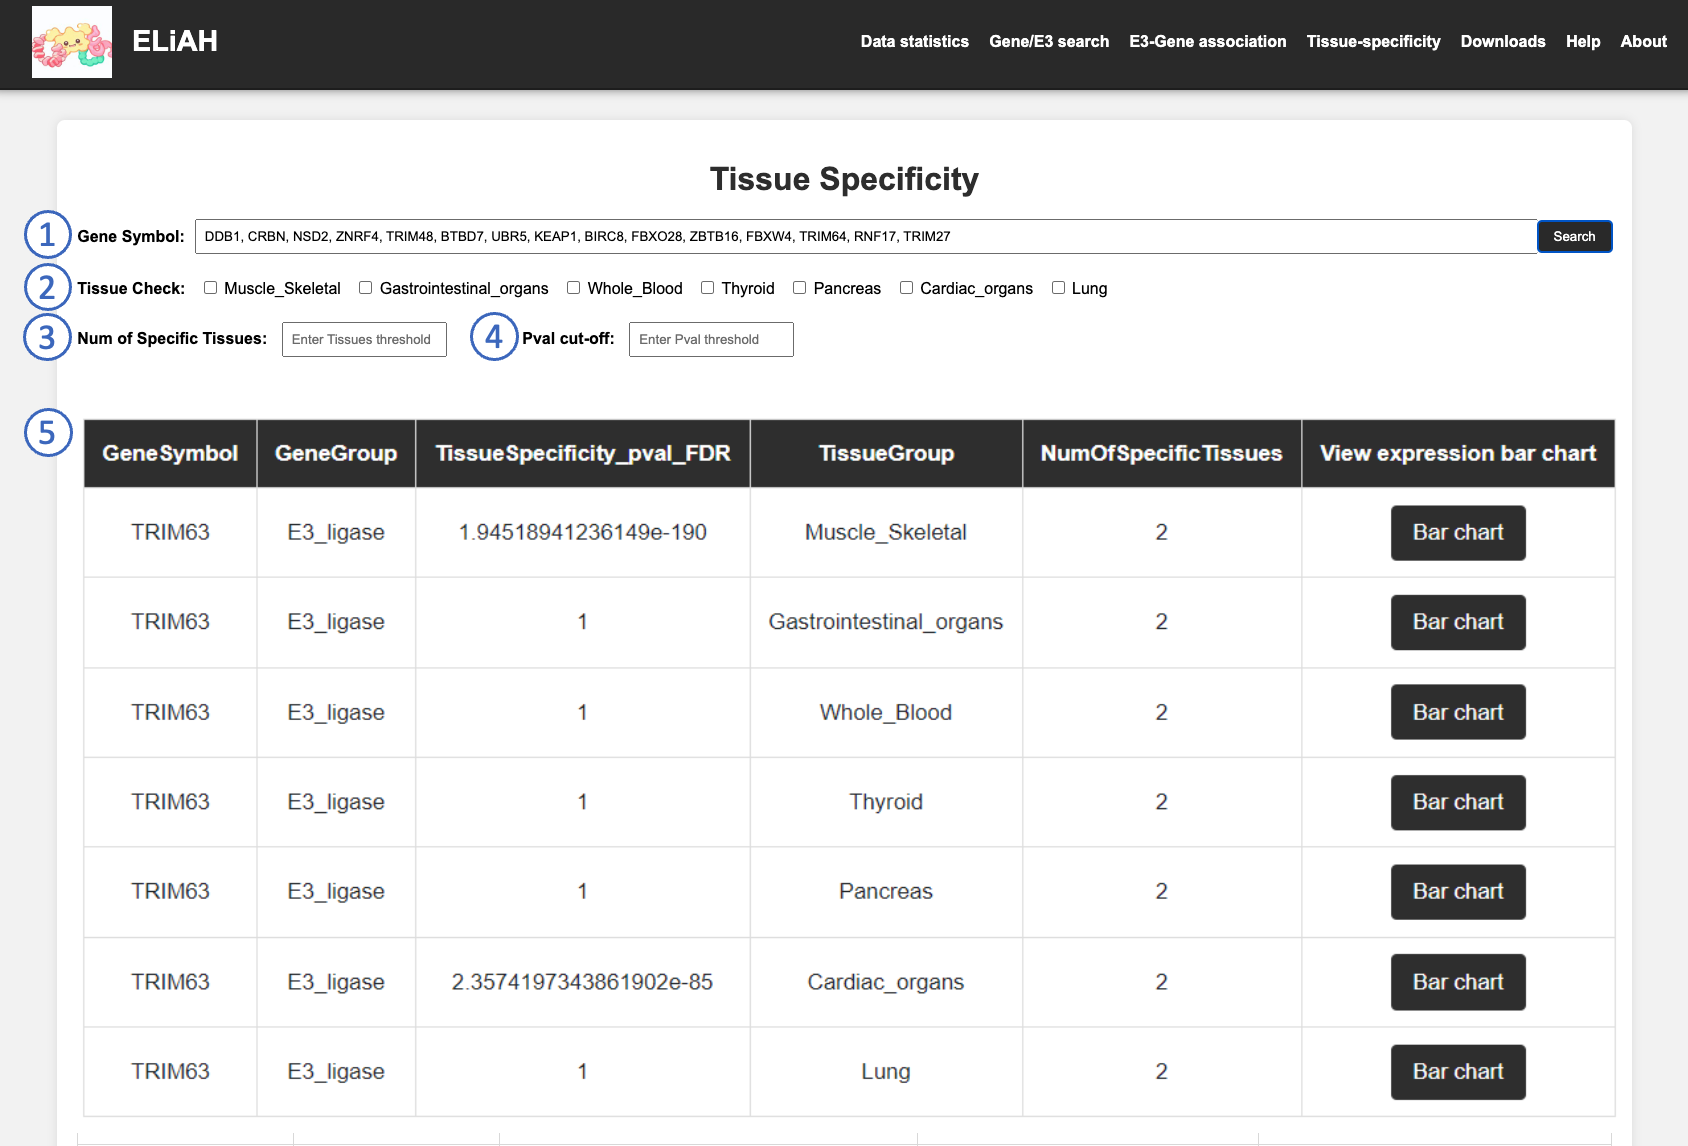
Users can search for specific tissues to understand how the expression of E3 ligases varies across different tissues.
Search box for exploring tissue-specificity.
Users can choose interesting Tissue Group by click checkboxes.
User can set the Number of specific Tissues of each gene. Number of specific Tissues refers to the number of tissues that exhibit a P value less than 0.05 for a gene.
Users can set the maximum P value cut off for narrow down to gene list of higher tissue specificity.
The output table of user requested tissue specificity list
[ Column description ]
GeneSymbol — gene symbol of E3 ligase or inferred gene that user requested.
GeneGroup — E3 ligase or inferred gene.
TissueSpecificity_pval_FDR — The FDR-adjusted significance value indicates the tissue specificity of a gene determined through a one-tailed Mann-Whitney U test, comparing it to other tissue groups.
TissueGroup — 7 tissue groups for transcriptomic analysis. Similar tissue samples are combined into the same group.
Num of Specific Tissue — Number of specific Tissues refers to the number of tissues that exhibit a FDR-adjusted P value less than 0.05 for a gene.
View PDB Structure — Button for link to expression bar chart page of each gene..
View expression bar plot — Button for link to gene expression bar chart page of each gene.
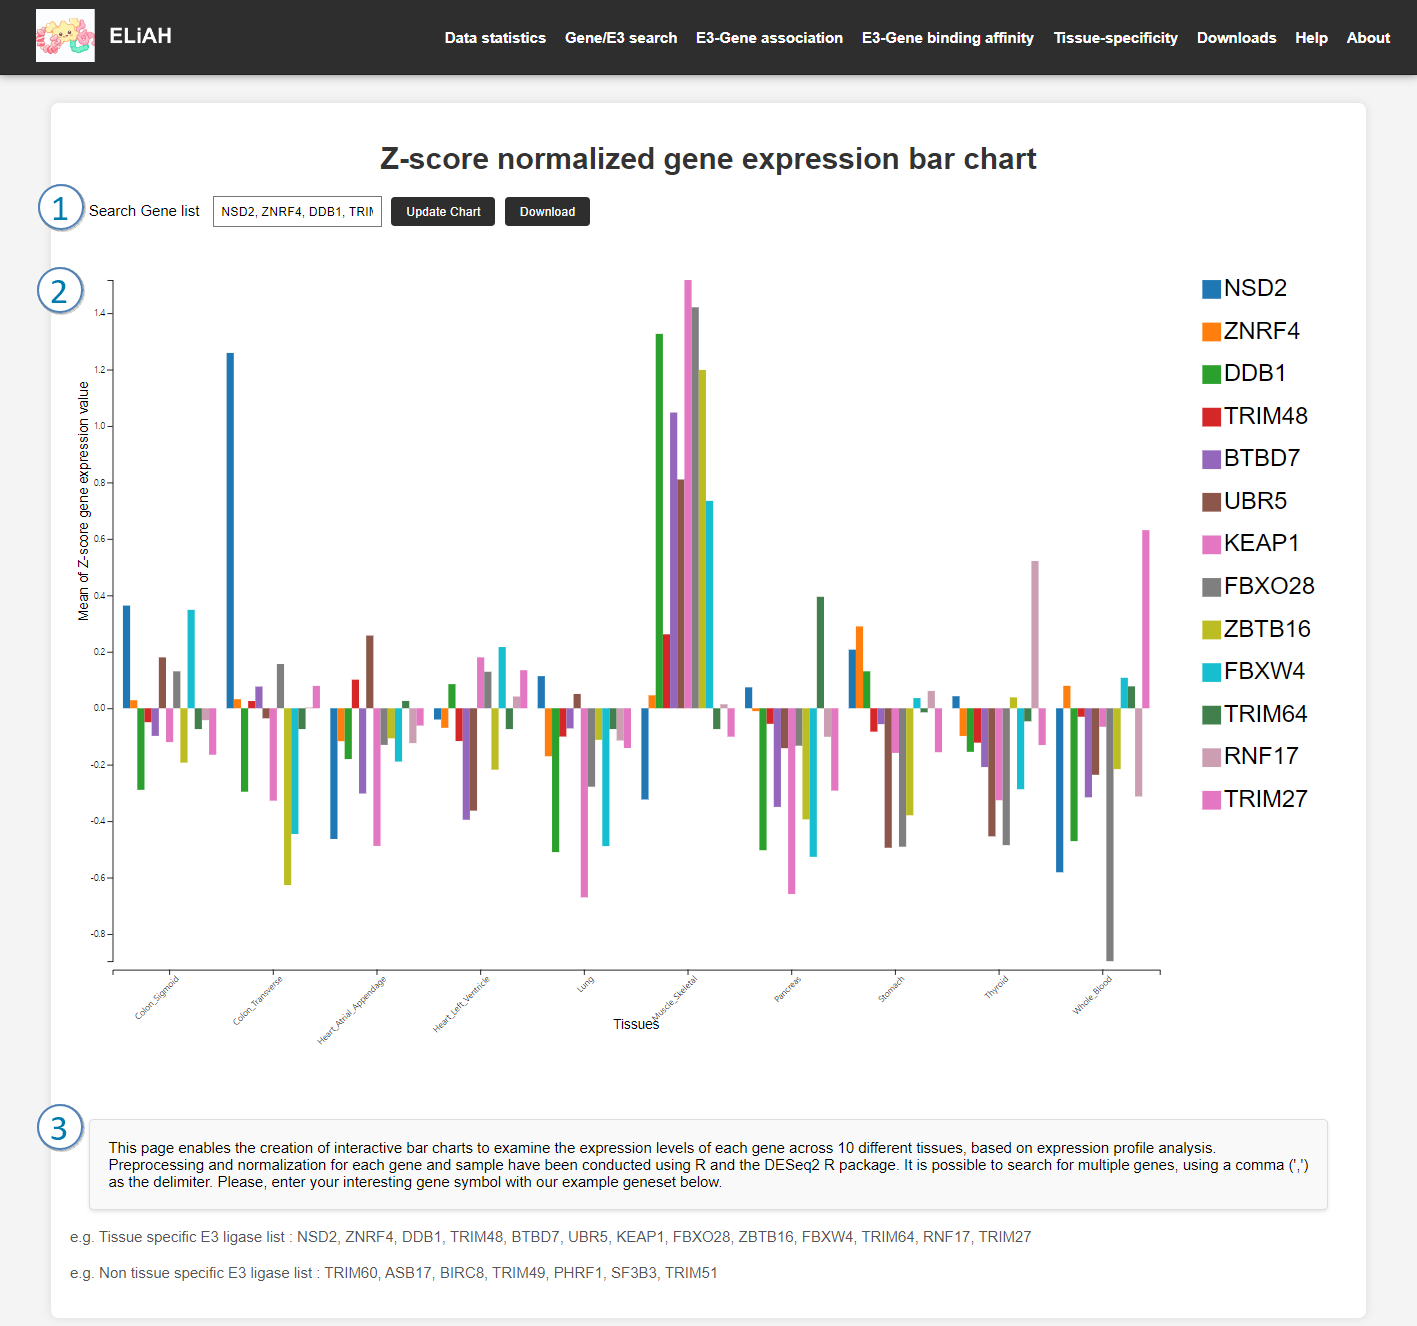
Interactive gene expression bar plot for selected gene list of interest across tissue
ELiAH contains an interactive gene expression bar plot, allowing users to search for the mean gene expression values normalized by Z score across various tissues
The search box supports multiple searches using a comma (,) as a separator.
Examine the mean expression level of the gene for each tissue based on a value of 0.0.
E3-Gene association page
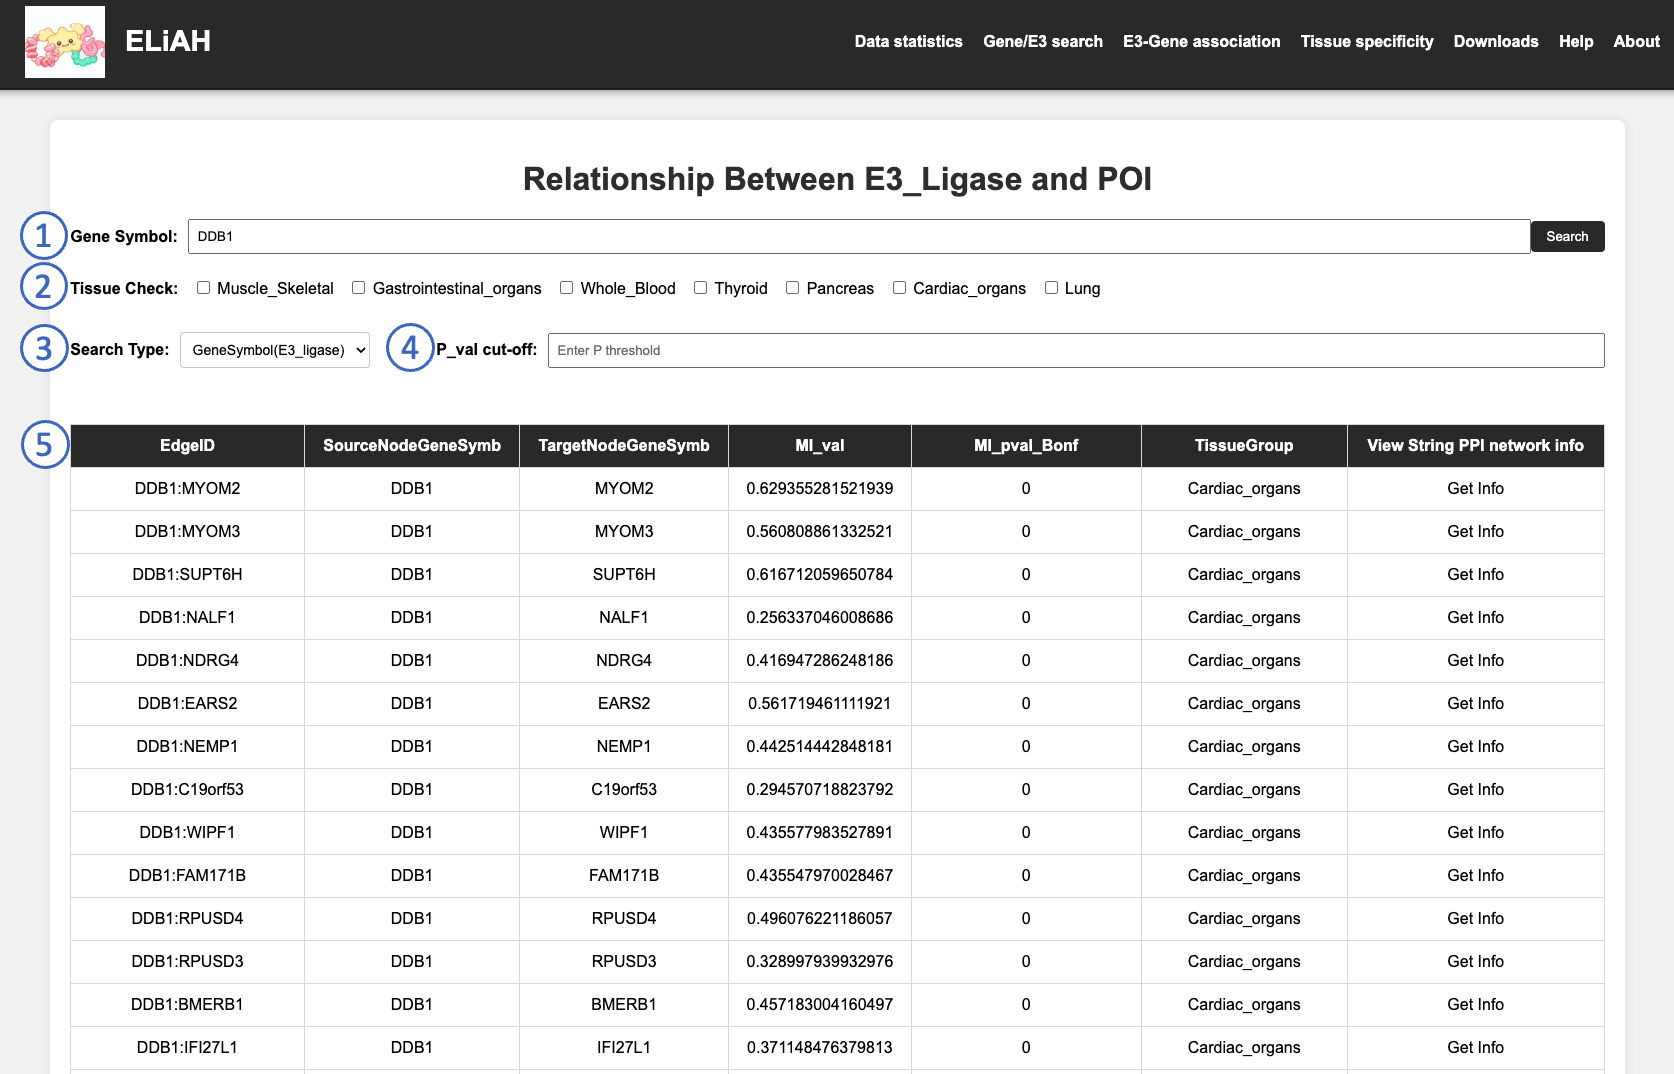
ELiAH offers a unique feature that allows users to explore associations between E3 ligases and inferred genes.
Search box for exploring associations between E3 ligases and inferred genes.
Users can choose interesting tissue group by click checkboxes.
Users can choose search type for gene pair by specifying a particular E3 or a paired gene that has been inferred.
Users can set the cut off of minimum MI (mutual information) value that represent degree of inferred association for narrow down to gene pair list of highly associated.
The output table of user requested E3-Gene association list.
[ Column description ]
EdgeID — Gene pair id of E3 ligase and inferred gene from ARACNe-AP.
SourceNodeGeneSymb — E3 ligase gene symbol that has been used for source node.
TargetNodeGeneSymb — Inferred gene symbol that has been predicted as mutual interactor of E3 ligase.
MI_val — Mutual interaction association value between SourceNodeGeneSymb and TargetNodeGeneSymb.
MI_pval_Bonf — Bonferroni adjusted significance value of interaction between gene pair. (ascending scale)
TissueGroup — 7 tissue groups for transcriptomic analysis. Similar tissue samples are combined into the same group.
View STRING PPI network info — Button for link to STRING page of each gene pair.
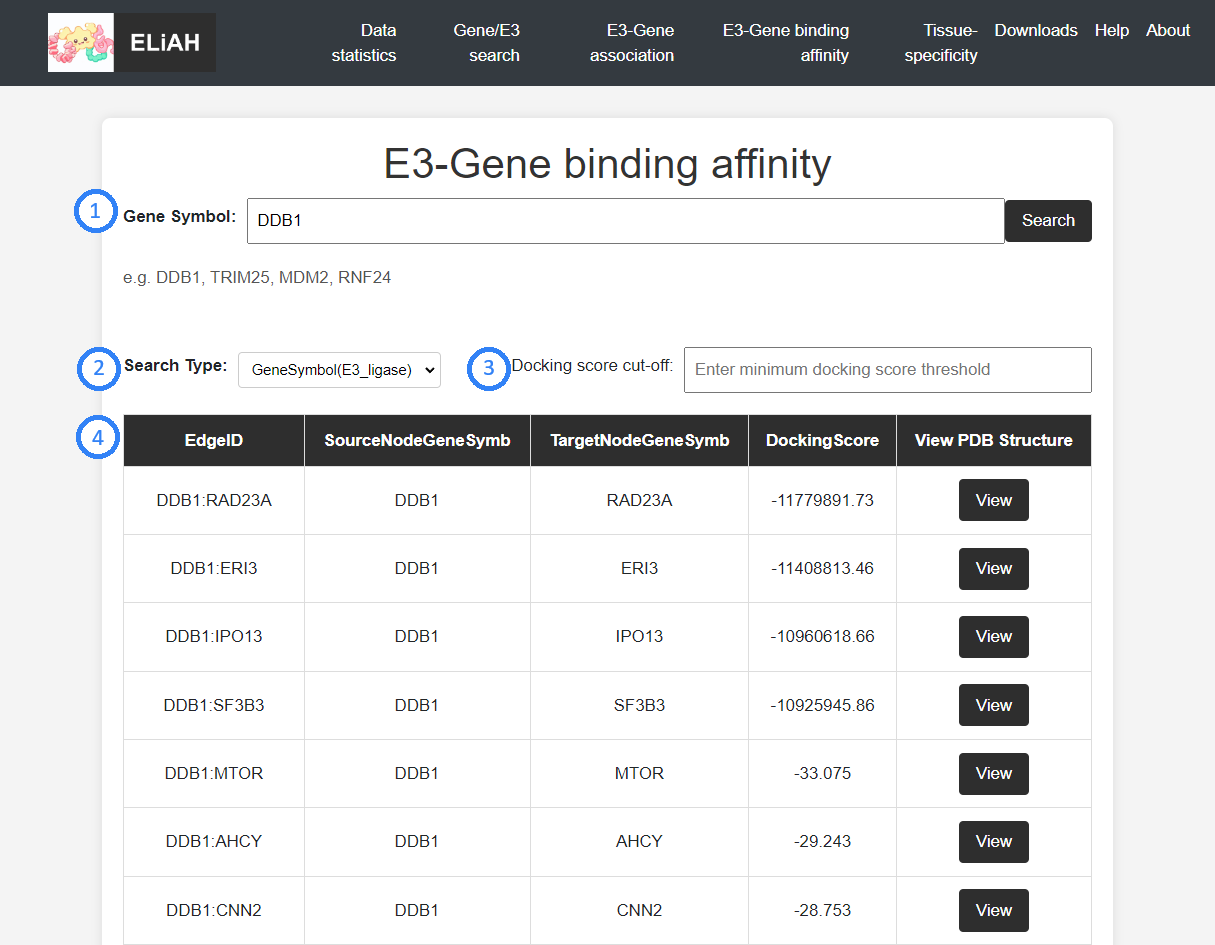
E3-Gene binding affinity
This page in ELiAH is providing information about the binding affinities between E3 ligases and their inferred target proteins. Users can explore the binding affinities of each gene pair.
Search box for exploring binding affinity between E3 ligases and inferred genes.
Users can choose search type for gene pair by specifying a particular E3 or a paired gene that has been inferred.
Users can set the cut off of minimum Docking score value that represent degree of binding affiniity between gene pair of inferred edge.
The output table of user requested E3-Gene binding affinity list.
[ Column description ]
EdgeID — Gene pair id of E3 ligase and inferred gene from ARACNe-AP.
SourceNodeGeneSymb — E3 ligase gene symbol that has been used for source node.
TargetNodeGeneSymb — Inferred gene symbol that has been predicted as mutual interactor of E3 ligase.
DockingScore — Docking score value between SourceNodeGeneSymb and TargetNodeGeneSymb.
View PDB Structure — Button for link to PDB structure page of each gene pair.
PDB structure
This page in ELiAH is providing information about the structure between E3 ligases and their inferred target proteins. Users can explore the structural image using D3mol.js interface in each gene pair.
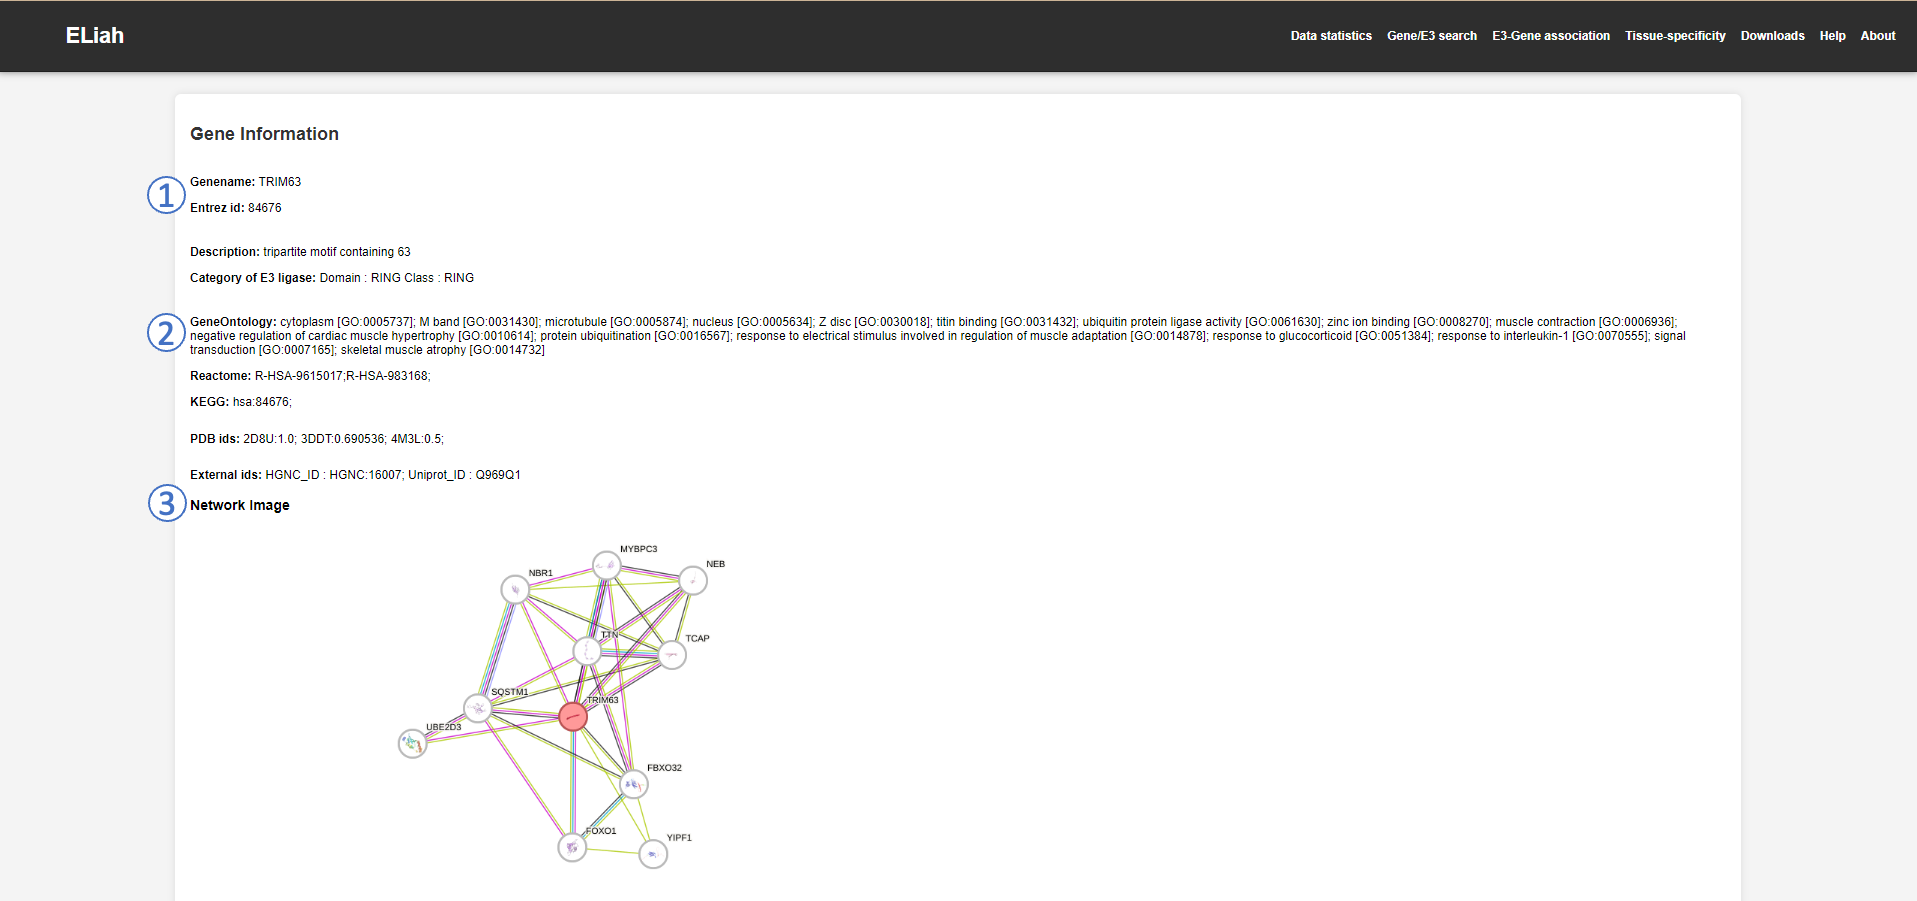
Gene information page
The gene information page in ELiAH provides comprehensive information about specific E3 ligase genes or their association partners. Users can access details by click each value for moving external site.
Representing user clicked single gene’s basic information such as Entrez id, Protein name, Category(only for E3 ligase).
Gene ontology, Pathway, KEGG, PDB id (external site linked).
User clicked single gene’s PPI network from STRING DB.